I have developed several SVG applications over the years. Up until recently, my focus was not on performance but on getting them to work in multiple viewers. In the last few years, most of the major browsers have developed reasonable support for SVG. When Firefox 3 came out, I found that it was actually fast enough to render one of my applications at a reasonable update rate.
This article describes the process I used to determine how quickly some of the viewers can update SVG using ECMAscript and to see how the viewers compare. I describe both my results and testing methodology so that other people can duplicate my results. The intent of this experiment is to measure the capabilities of some current SVG viewers. I do not intend to find which viewer is the fastest, but to study what is feasible with scripting.
The main conclusions I can draw from this experiment is that script-based animation of SVG is fast enough for many applications. Moreover, the different viewers that I tested were all fast enough to have consistent behavior between viewers over a wide range of update rates. Finally, as expected, the speed at which a particular viewer can update the SVG is very dependent on the kind of manipulations that are done.
For this experiment, I am measuring the maximum update frequency of an
SVG document. I am
determining this frequency by counting the number of times a function is
executed using the setInterval() ECMAscript function. I am not
measuring the actual rendering frequency because I have no way to directly
determine that from the script.
I am also explicitly not measuring either CPU or memory usage in these experiments. Although these performance measures are important and worthy of study, I felt that focusing on one measure at a time would yield more concrete results.
Another approach to script-based animation is to use
setTimeout() to fire an update method. To make the animation
continuous, the update method must reschedule the update with
setTimeout() again. In theory, this would make the wait time be
less dependent on the amount of work being done during the update.
Unfortunately, this approach is subject to a bug reported in Firefox. [1] In my tests, there was no sign of symptoms of this bug.
However, this is a valid animation technique that should be explored in a later
test.
Absolute performance measures are incredibly hard to reproduce (or understand). So don't take the absolute numbers too seriously. The more important measures are relative. How do different interval sizes effect the update rate? How does one viewer perform relative to another (at least on my platform)?
I have run my performance tests on three different viewers (Batik 1.8 pre-release, Firefox 3.03, and Opera 9.6) with three different SVG applications. Each viewer is run with all three applications and the results for each application are compared. The first application is a reference application that does minimal work in order to establish a benchmark of the maximum update rates for each viewer. The other two applications are demos that I have had on my website for years. They have both been modified to contain code that does the profiling.
The reference application establishes a baseline update rate that is effectively the fastest the viewer can achieve. This gives some measure of the overhead of the profiling code on the viewer under test. The difference between this baseline and the measurements for another application shows the cost for the script actually executed in that application.

The control application (labeled Minimal) has a black rectangle as a background and one text area that is updated by the profiling code (just like the other two). On each update, the application calls the profiler to update the current count. No modifications of the DOM are made and no real work is performed by the script.
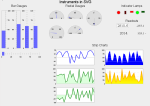
The next application is a profiled version of my Instruments demo. This application manipulates a set of SVG objects designed to mimic typical reporting instruments: bar graphs, radial dials, strip charts, and numeric readouts. This test does a small amount of calculation in the script and mostly performs scaling, rotation, and text updates to the various SVG objects.
The final application is a profiled version of my Wuse program. This application is basically nothing more than eye candy, but it does exercise the SVG scripting in a much different way than the Instruments demo. On each update, this application performs some calculations, updates the position of one end of a line and modifies the color of several lines.
Obviously, the measurements only make sense in the context the platform I am using for the tests. My tests were run on Ubuntu running on a 1.66 GHz Core 2 Duo machine. Batik was run with Sun's Java version 1.6. The numbers on a different machine could be very different.
One might ask why we should benchmark script-based animation. After all, SVG supports a very powerful declarative animation system using SMIL. There are several answers to this question.
For these reasons, scripting will probably remain a useful tool in the SVG developer's tool chest. Testing the performance of script-based animation gives some information on how useful the technique is for many applications.
I had a few applications that were already doing script-based animations. One of them, Wuse, had performed miserably on early versions of the Firefox browser. This was not unexpected since SVG support was very new at that point. I recently opened Wuse again in a more modern Firefox and was surprised at the improvement in the performance. This lead me to wonder how it compared to other SVG viewers that I have access to.
Rather than spend a lot of time trying to develop a powerful, comprehensive method for profiling the code, I decided to stick with a simple counter-based approach. It has the following advantages:
Using this profiler we can easily test how changes to the SVG modifies the performance characteristics.
The goal is not to provide a definitive answer about the speeds of the various viewers or to minutely measure the performance of various techniques. The idea is to determine if script-based animation in SVG is good enough for different purposes. It also gives a more analytical measure than it seems faster.
The use of this profiling approach does rely on some assumptions. The code
assumes that the viewer calls the scheduled update function at an interval that
has some relation to the requested interval. The approach also assumes that the
Date.getTime() method returns a value related to the actual time.
We would also like to assume that the viewer renders the changes some time
shortly after the changes are made to the image.
David Dailey has reported that the update function driven by
setTimeout() will only be executed after the rendering for the
previous update is complete. [2] Further testing would be
needed to prove the same effect applies for setInterval().
Dailey's paper performs a similar form of profiling. In his paper, the
experiments measure differences between the expect time for updates to occur
and the actual time.
The Dailey paper also focused more on testing individual techniques than on larger applications. My experiments used an automated approach to gather more data at a time, based on the (possibly invalid) assumption that I could not reasonably measure rendering. The Dailey experiments used a more flexible means of modifying parameters to test a larger number of variations in a single test. The results described here can be seen as somewhat complementary to the results from that paper.
Before examining the details, it is important to point out that all of the viewers did quite well on the tests. Comparisons of the actual measurements are less useful in general because they depend strongly on platform characteristics such as processor and operating system. The important point was that in all cases, the viewers were able to manage on the order of 20-50 updates per second. This is very different from my unscientific experiments of a few years ago. At this update rate, we can expect fairly smooth, continuous animation driven by scripting.
At very low interval sizes (high potential update rate), the variation in the measurements was fairly high. This is to be expected, since we would be pushing the viewers harder as the interval size drops. As the interval size became relatively high (low update rate), the variation reduces and all of the viewers become more similar in their performance. This is also to be expected. Even if the overhead for each update had been very high, if we wait long enough, all of the viewers should complete their work within the specified interval.
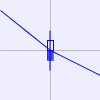
On the charts that follow, the data points are marked by a symbol like the one to the right. This mark shows 5 pieces of information at once. The average value is marked by the point where the vertical line crosses the horizontal line in the box. The data line goes through this point. The points of the vertical line mark the minimum and maximum values. The open box represents one standard deviation above the mean. The filled box represents one standard deviation below the mean. The height of the boxes, therefore, gives an idea of the variability in the data.
The control case for the performance testing is the Minimal
Test. This case is driven by the minimal_benchmark.svg
file. The functionality run on each update was the minimum needed to trigger
the profiler: a method call and variable increment. The purpose of this
case is to establish a baseline for a minimal amount of script to run for
an update.
| Interval | Batik 1.8 pre | Firefox 3.03 | Opera 9.6 |
|---|---|---|---|
| 5 | 198.76 | 98.63 | 83.54 |
| 10 | 99.67 | 98.62 | 83.69 |
| 15 | 66.51 | 66.41 | 62.39 |
| 20 | 49.91 | 49.84 | 49.93 |
| 25 | 39.94 | 39.94 | 39.93 |
| 30 | 33.29 | 33.24 | 31.29 |
| 35 | 28.54 | 28.55 | 27.75 |
| 40 | 24.98 | 25.00 | 24.97 |
| 45 | 22.20 | 22.22 | 22.28 |
| 50 | 19.99 | 20.00 | 19.25 |

Batik provided a fairly large surprise in that its update rate remained relatively close to the theoretical maximum update rate for each interval size tested. This suggests that the overhead for the script animation is very low in Batik.
At least as far as was tested, Batik continued to increase its update rate with smaller interval sizes. Both Firefox and Opera appeared to have a minimum interval size around 10 ms. Since this would result in a theoretical rate of 100 updates per second, that's probably not an unreasonable design decision.
In the range of 50 to 20 ms interval size, the three viewers were effectively equivalent.
Interestingly, Opera did show some unusual variability in measured update rates at the 25 and 45 ms interval sizes. Further testing would be needed to determine if this was an anomaly of that particular test or some strangeness in the Opera viewer.
The Instruments case involves modification to attributes and classes of a number of SVG objects. It also contains some text updates. The amount of calculation in the script is relatively minimal, although it does make extensive use of the random number generator.
| Interval | Batik 1.8 pre | Firefox 3.03 | Opera 9.6 |
|---|---|---|---|
| 5 | 180.73 | 88.35 | 63.68 |
| 10 | 96.37 | 88.29 | 63.47 |
| 15 | 65.52 | 66.34 | 54.16 |
| 20 | 49.49 | 49.80 | 45.84 |
| 25 | 39.76 | 39.88 | 36.99 |
| 30 | 33.23 | 33.29 | 31.34 |
| 35 | 28.53 | 28.53 | 27.65 |
| 40 | 24.97 | 25.00 | 23.87 |
| 45 | 22.19 | 22.22 | 21.06 |
| 50 | 19.97 | 20.00 | 19.22 |

The performance curves for the Instruments test are similar to the curves for the Minimal test. Once again, Opera and Firefox reached cutoff points at around 10 ms interval size. Also, all three viewers had performance that was very close in the range of 20 and 50 ms. Since 20 to 50 updates per second is fast enough to perform very smooth animation, this would make it possible to develop animations that appear very close to the same in the three browsers. Opera lagged a bit more on this test. Unlike the Minimal test, Opera did not show any unusual variance.
The Wuse test definitely pushed all three viewers harder than the other
tests. On each update, it modifies the position of one end of a line and updated
the stroke color of 16 lines. But it also did quite a bit of calculation
and conditional logic. This included a number of calls to the random number
generator and calls to both sin() and cos().
| Interval | Batik 1.8 pre | Firefox 3.03 | Opera 9.6 |
|---|---|---|---|
| 5 | 105.47 | 23.01 | 26.91 |
| 10 | 88.54 | 27.93 | 23.08 |
| 15 | 65.50 | 24.09 | 24.64 |
| 20 | 49.70 | 27.16 | 27.41 |
| 25 | 39.91 | 31.41 | 21.98 |
| 30 | 33.27 | 25.27 | 21.67 |
| 35 | 28.53 | 24.78 | 25.47 |
| 40 | 24.97 | 24.33 | 23.10 |
| 45 | 22.20 | 22.08 | 19.61 |
| 50 | 19.98 | 19.79 | 19.20 |

Batik still seemed to follow the same shape of performance curve, though with a definite reduced rate. Firefox's range was significantly slower, between about 20 and 32 updates per second. Opera ranged between about 19 and 28 updates per second.
More sampling would be needed around the peaks to determine what interval gives the highest update rate for Opera and Firefox.
The SVG files being
profiled use a relatively standard approach to script-based animation. The
setInterval() function is used to schedule an update function
to be called every x milliseconds. Each update will take some
period of time to execute. If the update takes more time to execute than the
interval size, the next update is delayed.
This gives an obvious approach to profiling the code. Count the number
of times the update method is called. This count is then sampled in another
function scheduled by a second call to setInterval() with a much
longer interval. The change in the count from the last value divided by the
amount of time since the last sample gives a good average update rate.
By varying the time interval used for the update method, we can study the relation between requested update rate and actual measured update rate. The update time interval was varied in 5 ms increments in the range of 5 ms to 50 ms.
In this thread from mozilla.dev.tech.svg, Boris Zbarsky explains how the
setTimeout() and setInterval() methods work on
Gecko-based browsers. [5] One interesting datapoint that
has a major bearing on this experiment has to do with scheduled code that takes
longer than the defined interval. Instead of shifting the interval by a small
amount to compensate for the overrun, the Gecko engine (at least) skips the
update at the interval that was overrun and lets the update happen at the next
interval. In other words, if we have an interval of 20ms and a function that
runs reliably in 21ms, we can expect the update function to be called at 20ms,
60ms, 100ms, etc. skipping every other interval.
In addition to the update method scheduled using setInterval(),
another function was scheduled at a longer interval of 10 seconds. This 10
second sampling interval seemed long enough to reduce the sampling error.
The time difference between calls to this sampling function was measured
using the Date.getTime() method. The difference in the count
generated with the update method was also measured. The count divided by
this time difference gives an average update rate. A number of samples like
this were taken at each update interval. These samples are averaged to give
a value for each interval size.
The data at each sample were written to a text element to allow the user to gauge progress. In addition, the data was sent as parameters in a request to an HTML page. The results of this page request were ignored. The only purpose in this request was to generate a webserver log entry for the request. The data would eventually be harvested from these log files.
Three different applications were tested to provide measures of different amounts of work. The same data for each application was collected for three different viewers. All of the data was graphed to allow visual comparison of the data.
Another script makes a new page request after a given (long) period of time. This allows for automated runs of the test on a given viewer. The script cycles through the interval sizes for a given application and then moves to the next application. This gives repeatable results without me needing to sit in front of the computer and change the intervals and applications. The only difficulty with this approach was that the functionality to request a new page was missing from Batik. [6] A patch was submitted for the 1.8 pre-release version to support this functionality.
The data for a given interval contains a fair amount of variation. There is also a bit of error in the sampling interval. The data for a given interval is averaged to give an update rate for the interval. Three different sampling approaches were explored to reduce the variation in the data.
N samples.N samples.N+2 samples, drop the highest and lowest
and average the rest.Each of these sampling strategies were tried and three statistics were calculated: mean, median, and standard deviation. Comparing the mean and median showed that the two were relatively close. In addition, sometimes the mean was larger and other times it was the median. There did not seem to be any systematic bias between the two.
Since the measured update rates cannot be negative and the fact that the mechanisms of bias should be mostly random, assuming a gamma distribution seems fairly reasonable.
If the mean of a gamma distribution is large enough, it tends to look something like a normal distribution, the standard deviation of the data should give an idea of which sampling approach would be the most stable. Of the three sampling approaches, the third gave the lowest variation.
In the end, the measurements were done using the third sampling method
with N equal to 50. So, at least 52 samples must be taken.
Although there is a lot of variation between the three viewers tested at very high update rates, they all performed fairly consistently in the 20 ms to 50 ms interval size. As expected, different work in the scripts has a very strong effect on the update rate. As long as the interval size does not become too small, the viewers could sustain update rates around 20 to 50 updates per second or better. This update rate is high enough to generate fairly smooth animation.
Someone might question the need for update rates faster than the frame rate of the monitor displaying the SVG. Most movies use a frame rate of 24 fps. Monitors are actually capable of refresh rates of between 50Hz and 120Hz. This gives a fairly wide range of potentially useful update rates.
Choosing an optimal update rate is would depend on how quickly a human observer can detect the change. Updates that occur faster than a person can detect could be considered to be a waste of resources. However, a person's ability to detect changes is actually a very complicated problem. [7] There does not seem to be any firm value that we can call the fastest refresh rate that matters.
Instead of making an arbitrary cutoff, I decided to make a series of measurements to determine what was possible. While a faster update rate may not be directly useful, we might expect that a viewer capable of faster update rates may be able to generate smoother animation. Moreover, if a particular viewer can do a given amount of work with a very high update rate, it may be able to do more work while still sustaining a reasonable update rate. Proving this would make a good experiment for a different time.
The only results worth reporting are ones that others can reproduce,
so I'm including the materials I used to run the tests and my initial
sets of result data in this tarball. To
duplicate the tests, you will need access to a webserver where you can put
the appropriate files. You can then follow the instructions in the enclosed
README file.
Now that the infrastructure and profiling tools have been written, there are many other directions that can be explored. The most obvious is to profile more SVG files, with different mixes of manipulations.
Tests comparing different image manipulations with similar effects might
be interesting. For example, a comparison of changing the center of a circle
vs. using the transform attribute to translate it.
Measurements of different filter effects could also be interesting.
There have been a number of reports that some viewers (notably Batik) are slow with some text operations. These tools could be used to give some solid information about this issue. We could also add performance information to the ongoing debate of the difference between presentation attributes and CSS styling.
Obviously, tests of more viewers and platforms would be useful. Although we can only usefully compare viewers on the same platform, this kind of profiling is still useful to gauge the feasibility of different applications.
Although the current tests are somewhat automatic, more automation of the testing would definitely be a benefit to anyone duplicating this test. At the moment, the post-processing stage is somewhat primitive and could benefit from more work. Better analysis of the data might yield more useful information from the data logged in the test.
Finally, a few longer test runs are needed to help validate the assumption of a gamma distribution of the samples.
More testing of intervals close to the 10ms estimated cutoff for Firefox and Opera would be useful to establish the actual value of the cutoff.
It would probably be worth testing the setTimeout()-based
scripting approach. That would allow comparison with the current approach. It
might also be possible to test the Firefox bug described earlier. [1]
A test that verifies whether other viewers treat interval overrun the same as Firefox would be useful.
setTimeout(): http://groups.google.com/group/mozilla.dev.tech.svg/browse_thread/thread/b5b7edfd7a3410b2/3d1ca2c0ca014ab5My wife, Debbie Campbell, provided the initial editing, and review. Members of the SVG Developers Yahoo Group also reviewed the article. I am indebted to Frank Bruder, Erik Dahlström, Helder Magalhães, and Cameron McCormack, who provided insights and suggestions after reading a draft of the article. The article is better for their help. Any errors that remain are purely my responsibility.